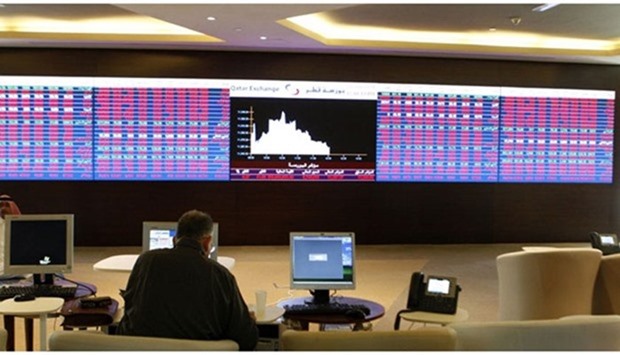
Trading value during the week decreased by 7.3% to reach QR1.0bn versus QR1.1bn in the prior week. The Industrials sector led the trading value during the week, accounting for 28.7% of the total trading value. The Banks and Financial Services sector was the second biggest contributor to the overall trading value, accounting for 25.2% of the total trading value. Qatari Investors Group (QIGD) was the top value traded stock during the week with total traded value of QR163.0mn.
Trading volume decreased by 2.6% to reach 28.7mn shares versus 29.5mn shares in the prior week. The number of transactions decreased by 14.7% to reach 13,274 transactions versus 15,552 transactions in the prior week. The Telecoms sector led the trading volume, accounting for 34.1%, followed by the Banks and Financial Services sector, which accounted for 20.1% of the overall trading volume. Vodafone Qatar (VFQS) was the top volume traded stock during the week with total traded volume of 8.8mn shares.
Foreign institutions remained bullish during the week with net buying of QR183.6mn vs. net buying of QR200.7mn in the prior week. Qatari institutions remained bearish with net selling of QR74.8mn vs. net selling of QR121.8mn the week before. Foreign retail investors remained bearish for the week with net selling of QR12.2mn vs. net selling of QR4.4mn in the prior week. Qatari retail investors remained bearish with net selling of QR96.6mn vs. net selling of QR74.4mn the week before. In 2016 YTD, foreign institutions bought (on a net basis) ~$1.6bn worth of Qatari equities.
Technical analysis of the QSE index
The Index remained stable as it ended the week marginally in the red at 10,357.33 (down 0.75% from last week). The weak movement continued below lower border of the uptrend channel. The Index needs a stronger move above the 10,650 with higher volumes to be healthy and does not break below the 10,000 support level. Our main resistance level remains at the 11,500 level.
Definitions of key terms used in technical analysis
Candlestick chart — A candlestick chart is a price chart that displays the high, low, open, and close for a security. The ‘body’ of the chart is portion between the open and close price, while the high and low intraday movements form the ‘shadow’. The candlestick may represent any time frame. We use a one-day candlestick chart (every candlestick represents one trading day) in our analysis.
Doji candlestick pattern — A Doji candlestick is formed when a security's open and close are practically equal. The pattern indicates indecisiveness, and based on preceding price actions and future confirmation, may indicate a bullish or bearish trend reversal.

