US gasoline consumption was significantly lower in April than reported at the time, new data published by the Energy Information Administration show.
Gasoline supplied to the domestic market averaged 9.213mn barrels per day (bpd) during April according to an estimate included in “Petroleum Supply Monthly” published on June 30.
Gasoline supplied was significantly lower than the four-week average of 9.474mn bpd contained in the final “Weekly Petroleum Status Report” for April published on May 4.
The downward revision in estimated consumption has encouraged analysts to reassess the strength of gasoline demand in the world’s largest driving market.
Strong demand for gasoline in the US, as well as emerging markets including India and China, has been cited as the main reason for strong growth in oil consumption in 2016.
Strong gasoline demand underpins the argument for oil market rebalancing so anything that triggers a re-evaluation has important implications for the wider oil market.
But the most reasonable interpretation of the data suggests that gasoline consumption was slightly understated in April after being overstated in March, while the underlying growth trend is little changed.
Most analysts regard the monthly gasoline supplied data as more reliable than their weekly counterparts.
Both are estimates and calculated as residuals from reported domestic gasoline production plus imports minus exports minus stock changes.
Data on production, imports and stock changes are reported to the EIA in weekly and monthly surveys of the industry.
Export data however is not reported to the EIA but to the US customs service.
EIA has to estimate exports at the time of producing the weekly data; by the time it has to produce the monthly numbers it has hard figures on exports from US customs.
Largely because of the problems associated with estimating exports in real time, most analysts regard the monthly data as more accurate.
Despite the differences, the gap between the daily consumption reported in the weekly surveys and the monthly survey for April amounts to just 260,000 bpd or 2.75%.
The gap is not especially large and actually represents a high level of accuracy given the enormous flows of physical oil which both the weekly and monthly surveys have to capture.
The lower level of gasoline consumption reported in the monthly survey is consistent with other data showing slower refinery run rates and an unusually high level of gasoline stocks in April.
Even at the lower level reported in the monthly survey, gasoline consumption was still up by 74,000 bpd compared with 2015 and only 2,000 bpd below the record rate set in 2007.
Moreover, there are some reasons to be cautious in relying on the monthly survey for April which comes after the previous monthly survey showed an exceptionally high level of consumption in March.
Monthly data put gasoline supplied at 9.4mn bpd in March, an increase of more than 340,000 bpd compared with the same month in 2015.
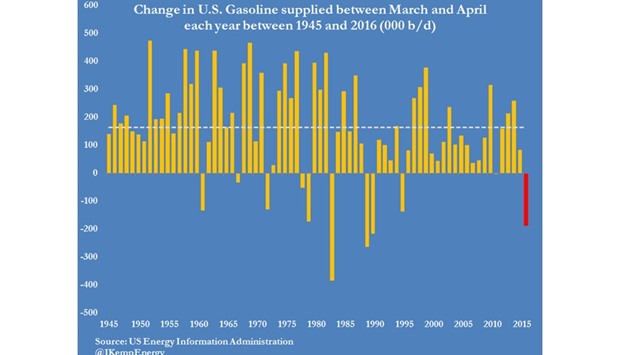
According to the monthly surveys, gasoline consumption then declined by 186,000 bpd between March and April, which if true, would be highly unusual.
Gasoline supplied normally increases significantly between March and April: the average increase over the last 70 years has been more than 160,000 bpd.
Gasoline supplied has only dropped between March and April in 10 years between 1945 and 2015.
The last significant decline was back in 1995. A reasonable conclusion is there is some noisiness in the data and that gasoline supplied was overstated in March and understated April.
The unusual decline in estimated consumption, and discrepancy between the weekly and monthly surveys for April, are a reminder about the dangers of over-interpreting noisy time series.
The broad picture, however, remains basically unchanged. US gasoline consumption continues to grow significantly compared with 2015 and is on course to exceed the previous peak set in 2007.

John Kemp is a columnist for Reuters. The views expressed are his own.
