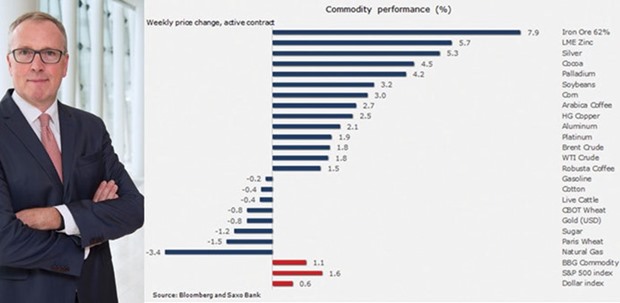
The commodity complex rose for a second week with support from multiple sources helping to offset a stronger dollar. China’s trade and growth data both pointed towards a stabilising but still debt fuelled economy.
This helped support industrial metals while also giving grains a boost due to strong demand for soybeans.
Crude oil reached a four-month high suffering losses before the meeting in Doha. Brent crude oil has rallied more than 60% from its January low.
The latest support, apart from a continued slowdown in US production, came from the International Energy Agency which in its monthly report said that the global market could almost balance before year-end.
Silver, which for the past month had seen increased demand from investors through exchange-traded products, took off and in the process left gold behind.
Silver’s use as an industrial metal on the back of improving Chinese data and its historic cheapness relative to gold was the main driver behind the continued demand.
The grain sector was supported by a strong pickup in Chinese demand for soybeans during March.
This helped support the biggest weekly gain for the bean since December while at the same time forcing short-covering in corn on speculation that US farmers may switch from corn to beans on better economics.
Gold continues to settle into the range that has prevailed for the past couple of months.
During this time, holdings in exchange-traded products backed by gold have stabilised following the big gold rush at the beginning of the year.
After failing to make a clean break above $1,255/oz, a stronger dollar helped pull it lower and currently gold is stuck in a range where support can be found at $1,210/oz.
Silver has increasingly been getting some attention following the big run-up in gold during the first quarter. Fund managers are looking for alternatives to the increased number of sovereign bonds trading at negative yields, and they found that in gold during the first quarter.
Following the strongest start to a year in decades, however, the rally has halted and this has supported a move towards focusing on silver instead.
Silver’s relative cheapness to gold, as expressed through the gold/silver ratio, peaked above 83 (ounces of silver per one ounce of gold) in late February. Prior to that, the previous peak was seen during the financial crisis back in 2008 and during the past 10 years it has been averaging 60.
This February saw strong demand for gold and it kept the ratio above 80, but as gold stabilised investors began looking for relative value.
That’s what they have found in silver and since early March the demand for silver ETP’s has been very strong (with gold stabilising).
The trigger for the outperformance seen this week came from Chinese data and the technical break down in the ratio. Silver, contrary to gold, has many industrial uses that account for more than half of annual demand.
As a result silver has now overtaken gold as the best performing precious metal this year. It also means that a technical break higher for silver itself or lower on the ratio is required to attract further momentum buying.
Crude oil reached a new high for 2016 before nervousness ahead of the Doha freeze talks on April 17 helped trigger some profit-taking. US inventories reversed the surprise decline from the previous week but support continued from another weekly decline in production. US production has dropped below 9mn b/d and has now fallen by 600,000 barrels/day since last July.
Ahead of the Doha talks, Bloomberg reported that tanker tracking data had found that Iran may have increased its shipments so far this April by more than 600,000 b/d to more than 2m b/d if confirmed Iran has singlehandedly offset the entire US production decline to date.
My comment to Bloomberg was that “Iranian volumes highlight that a rebalancing of the market will have to come primarily from countries outside Opec, provided that crude prices don’t rise too far. If Iran can keep up sales of that magnitude during the coming months when supply disruptions from northern Iraq and Nigeria begin to fade, we may have to look a bit further out for that rebalancing.”
Staying with the focus on rebalancing, some additional support was provided by the IEA which saw the global supply glut diminish faster than was expected. The slowdown in US shale oil production is gathering pace and this could see the supply surplus reduced to just 200,000 b/d during the second half of 2016.
A sharp reduction of excess supply does, however, come with a disclaimer about price. If the price of oil continues to rally from here it would eventually negatively impact the current production slowdown.
Increased hedging activity from producers could indicate that some are once again able to breathe and are desperate to rebuild their shattered balance sheets by steadying production.
The open interest on both WTI and especially Brent crude oil futures contract (as seen above) have been rising, which indicates increased activity from funds and/or increased hedging by producers.
The fact that Brent crude has seen the biggest jump could be a result of the recent collapse in the prompt contango spread that has reduced the pain of holding and rolling a long position.
The game-changer in the oil market these past few months has not been delivered by the (mostly) men slated to sit down in Doha on the weekend. Instead, the real impact is from the shale oil fields of North America and other high-cost producers. A surging oil price will eventually remove this support as it stabilises production.
Crude oil has increasingly been priced to perfection, but when it comes to oil, nothing is ever perfect.
On that basis, we view the current price of Brent crude as being at the higher end of a $35/b to $45/b range.
* Ole Hansen is head of commodity strategy at Saxo Bank.

Ole Hansen


