QNB Group (QNBK), Qatar Islamic Bank (QIBK) and Masraf Al Rayan (MARK) were the primary contributors to the weekly index decrease. QNBK was the biggest contributor, shedding 94.5 points from the index. QIBK was the second biggest contributor, erasing 70.3 points. MARK pulled the index down by 58.2 points.
Trading value during the week increased by 60.34% to reach QR1.15bn versus QR0.717bn in the prior week. The banks and financial services sector led the trading value during the week, accounting for 42.63% of the total. The industrials sector was the second biggest contributor, accounting for 28.27% of the total trading value. QNBK was the top value traded stock during the week with total traded value of QR197.9mn.
Trading volume increased by 50.41% to reach 27.9mn shares versus 18.5mn in the prior week. The number of transactions rose by 30.14% to reach 17,512 versus 13,456 in the prior week. The banks and financial services sector led the trading volume, accounting for 31.29%, followed by the industrials sector, which accounted for 23.56% of the overall trading volume.
Gulf International Services (GISS) was also the top volume traded stock during the week with total traded volume of 4.2mn shares.
Foreign institutions remained bearish during the week with net selling of QR226.1mn vs net selling of QR14.1mn in the prior week. Qatari institutions turned bullish with net buying of QR49.1mn vs net selling of QR69.2mn the week before. Foreign retail investors remained bullish for the week with net buying of QR14.1mn vs net buying of QR22.0mn in the prior week. Qatari retail investors remained bullish with net buying of QR162.9mn vs QR61.3mn the week before.
In 2016 year-to-date, foreign institutions sold $32.7mn worth of Qatari equities.
Technical analysis of the QSE index
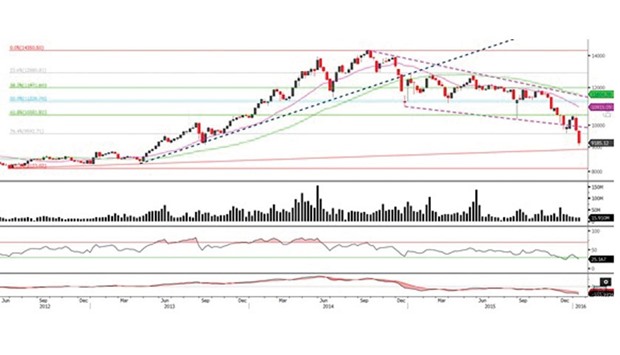
The QSE index closed at 9,185.12 and lost 5.9% vs the week before. Momentum indicators remain bearish and the index is moving away below its moving averages. Traded volumes increased substantially than the previous week’s volumes. As a result, the previous week suggests further weakness to be expected. We update our expected support level to 8,900 points and the resistance level to 10,500 points.
Definitions of key terms used in technical analysis
Candlestick chart – A candlestick chart is a price chart that displays the high, low, open, and close for a security. The ‘body’ of the chart is portion between the open and close price, while the high and low intraday movements form the ‘shadow’. The candlestick may represent any time frame. We use a one-day candlestick chart (every candlestick represents one trading day) in our analysis.
Doji candlestick pattern – A Doji candlestick is formed when a security’s open and close are practically equal. The pattern indicates indecisiveness, and based on preceding price actions and future confirmation, may indicate a bullish or bearish trend reversal.
DISCLAIMER
This report expresses the views and opinions of QNB Financial Services SPC (“QNBFS”) at a given time only. It is not an offer, promotion or recommendation to buy or sell securities or other investments, nor is it intended to constitute legal, tax, accounting, or financial advice. We therefore strongly advise potential investors to seek independent professional advice before making any investment decision. Although the information in this report has been obtained from sources that QNBFS believes to be reliable, we have not independently verified such information and it may not be accurate or complete. Gulf Times and QNBFS hereby disclaim any responsibility or any direct or indirect claim resulting from using this report.

