Technical analysis of the QSE index
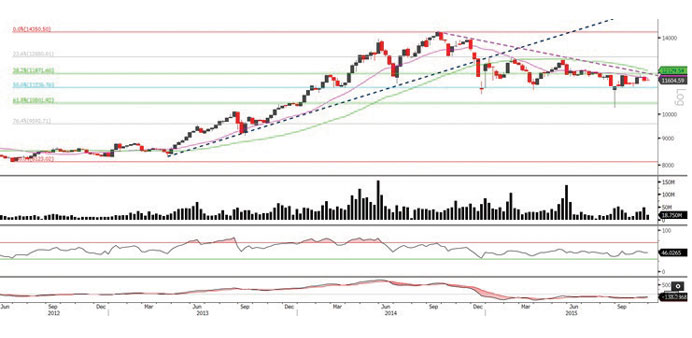
The QSE index moved marginally up by 0.17% vs the previous week; it is still moving in a short-term trading range. Uncertainty prevailed in the market as seen by the neutrality of movement and the low trading volumes. In turn, technical indicators were inactive and showed no signs of a projected move into one direction or the other. Weekly support and resistance levels remain around the 11,000 level and the 12,000 level, respectively.
Definitions of key terms used in technical analysis
Candlestick chart – A candlestick chart is a price chart that displays the high, low, open, and close for a security. The ‘body’ of the chart is portion between the open and close price, while the high and low intraday movements form the ‘shadow’. The candlestick may represent any time frame. We use a one-day candlestick chart (every candlestick represents one trading day) in our analysis.
Doji candlestick pattern – A Doji candlestick is formed when a security’s open and close are practically equal. The pattern indicates indecisiveness, and based on preceding price actions and future confirmation, may indicate a bullish or bearish trend reversal.