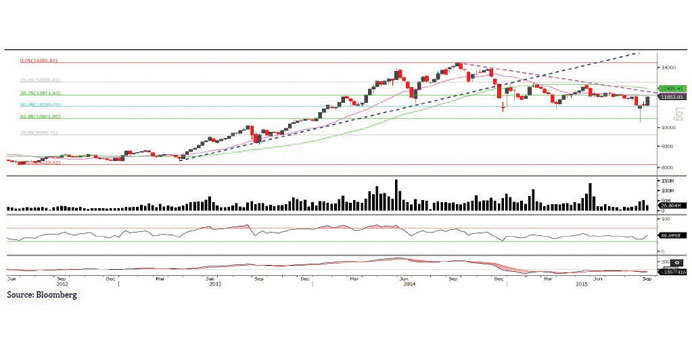
Technical analysis of the QSE index
The Qatar Index continued its recovery we mentioned last week. It gained 4.46% from the week before but on lower volumes. This bounce is expected to be met with high resistance levels, starting from the 11,900 level to the 12,200 level. It should be noted that we are still in a bearish trend until this status quo changes. On a different note, the closest support is going to be around the 11,300 level.
Definitions of key terms used in technical analysis
Candlestick chart – A candlestick chart is a price chart that displays the high, low, open, and close for a security. The ‘body’ of the chart is portion between the open and close price, while the high and low intraday movements form the ‘shadow’. The candlestick may represent any time frame. We use a one-day candlestick chart (every candlestick represents one trading day) in our analysis.
Doji candlestick pattern – A Doji candlestick is formed when a security’s open and close are practically equal. The pattern indicates indecisiveness, and based on preceding price actions and future confirmation, may indicate a bullish or bearish trend reversal.