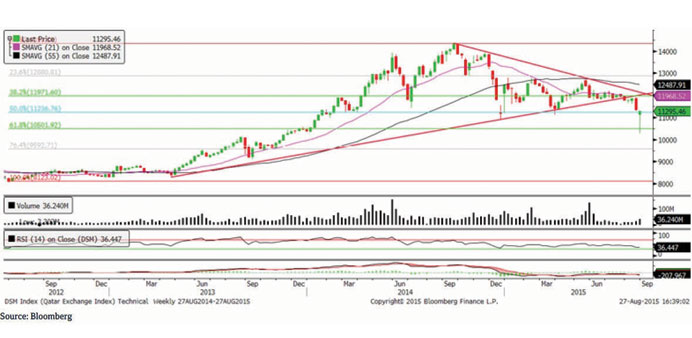
The QSE Index lost 0.44% vs the previous week. The RSI is moving close to the oversold zone, while the MACD is also in a bearish territory. However, the creation of the hammer candlestick on the weekly chart with high volumes is a good sign, suggesting a possibility of a rebound from the current level. On the other hand, traders may need to keep a close watch on the 10,900 level, as any break below that level portends further weakness. We update our weekly support and resistance levels between 10,900 and 11,800 points, respectively.
Candlestick chart – A candlestick chart is a price chart that displays the high, low, open, and close for a security. The ‘body’ of the chart is portion between the open and close price, while the high and low intraday movements form the ‘shadow’. The candlestick may represent any time frame. We use a one-day candlestick chart (every candlestick represents one trading day) in our analysis.
Doji candlestick pattern – A Doji candlestick is formed when a security’s open and close are practically equal. The pattern indicates indecisiveness, and based on preceding price actions and future confirmation, may indicate a bullish or bearish trend reversal.