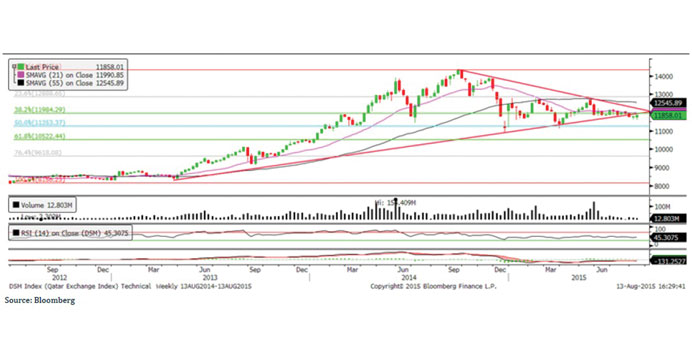
Technical analysis of the QSE index
The QSE index snapped the negative trend and rose by 0.75 % vs. the previous week. Volumes dropped further during the week, while the index reclaimed the important 11,800 level. To have a healthy bounce, the index needs an uptick, accompanied by higher volumes to bring back traders’ confidence. It is imperative to stay above 11,800 in order to further advance. Technical indicators are providing mixed signals. We update our weekly support and resistance levels between 11,800 and 12,600 respectively.
Definitions of key terms used in technical analysis
Candlestick chart – A candlestick chart is a price chart that displays the high, low, open, and close for a security. The ‘body’ of the chart is portion between the open and close price, while the high and low intraday movements form the ‘shadow’. The candlestick may represent any time frame. We use a one-day candlestick chart (every candlestick represents one trading day) in our analysis.
Doji candlestick pattern – A Doji candlestick is formed when a security’s open and close are practically equal. The pattern indicates indecisiveness, and based on preceding price actions and future confirmation, may indicate a bullish or bearish trend reversal.