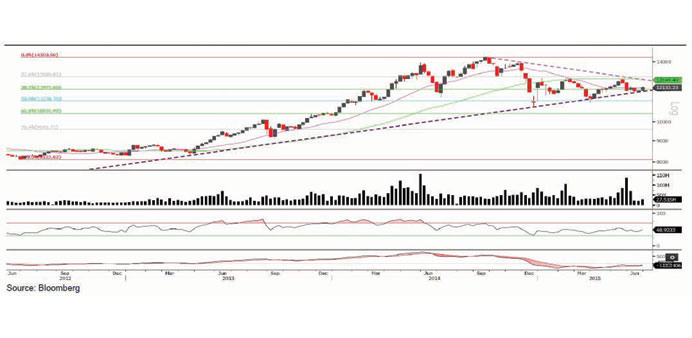
Technical analysis of the QSE index
The QSE index managed to gain 1.98% this week vs the previous week. Volumes are picking up but still below average. The index is trapped between the 11,800 support level and the 12,600 resistance level. We cannot say that technical indicators are positive, but we can stipulate that they are improving. If the Index breaks above 12,200 then it could continue higher. Otherwise, it will be stuck in limbo.
Definitions of key terms used in technical analysis
Candlestick chart – A candlestick chart is a price chart that displays the high, low, open, and close for a security. The ‘body’ of the chart is portion between the open and close price, while the high and low intraday movements form the ‘shadow’. The candlestick may represent any time frame. We use a one-day candlestick chart (every candlestick represents one trading day) in our analysis.
Doji candlestick pattern – A Doji candlestick is formed when a security’s open and close are practically equal. The pattern indicates indecisiveness, and based on preceding price actions and future confirmation, may indicate a bullish or bearish trend reversal.