Technical analysis of the QSE index
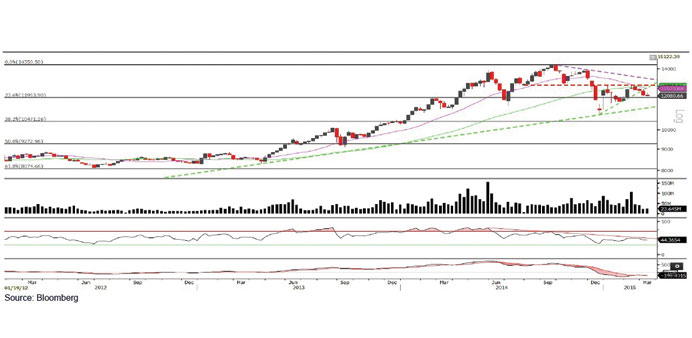
The QSE Index fell yet another week, accompanied by low traded volumes. It closed at the 12,080.66 level and lost 0.48% from the week before. Technical indicators are flattening down, caused by the marginal drop experienced throughout the week. Consequently, weakness could continue further. We expect a strong support level to be situated between the 12,000 and the 11,850 levels. The main resistance area is likely to be around the 12,350 level.
Definitions of key terms used in technical analysis
Candlestick chart – A candlestick chart is a price chart that displays the high, low, open, and close for a security. The ‘body’ of the chart is portion between the open and close price, while the high and low intraday movements form the ‘shadow’. The candlestick may represent any time frame. We use a one-day candlestick chart (every candlestick represents one trading day) in our analysis.
Doji candlestick pattern – A Doji candlestick is formed when a security’s open and close are practically equal. The pattern indicates indecisiveness, and based on preceding price actions and future confirmation, may indicate a bullish or bearish trend reversal.