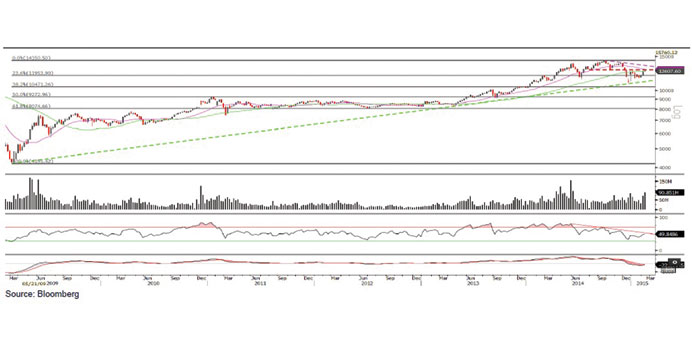

Technical analysis of the QSE index
The QSE Index ended the week at 12,607.60, gaining only 0.65% over the previous week. The Index created a Doji Star bearish reversal candlestick for the week, which signifies indecision among traders. The Doji Star candlestick comes with many implications as the traded volume was significantly higher than the week before. The only remedy for the index not to drop is to break above the 12,800 and sustain above that level. Technical indicators are becoming flat and are giving mixed signals. A drop may take the Index down again to the 12,000 level.
Definitions of key terms used in technical analysis
Candlestick chart – A candlestick chart is a price chart that displays the high, low, open, and close for a security. The ‘body’ of the chart is portion between the open and close price, while the high and low intraday movements form the ‘shadow’. The candlestick may represent any time frame. We use a one-day candlestick chart (every candlestick represents one trading day) in our analysis.
Doji candlestick pattern – A Doji candlestick is formed when a security’s open and close are practically equal. The pattern indicates indecisiveness, and based on preceding price actions and future confirmation, may indicate a bullish or bearish trend reversal.