


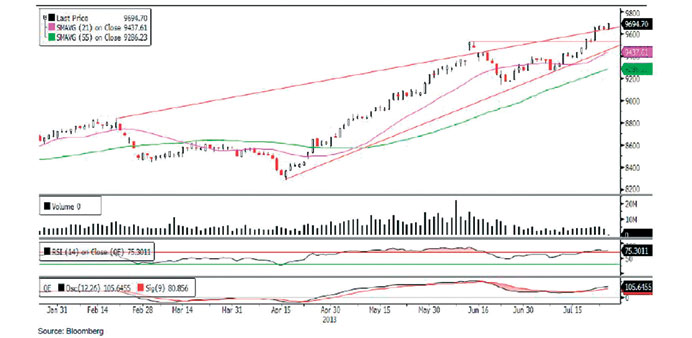
Technical analysis of the QE index
The QE Index continued its upmove last week and tagged another new 52-week high of 9,694.70 to close the week on a strong note, thus indicating strength. The index respected its ascending trendline support and rebounded on Thursday, thus confirming its bullish move. Moreover, the index breached two important levels of 9,600.0 and 9,650.0 on the back of large volumes indicating rising buying interest. We believe the current momentum may push the index higher to test and surpass the 9,700.0 level and start a new wave toward the 9,800.0-9,850.0 level. On the flip side, the ascending trendline support may be a key area to watch out for any decline next week. If the index penetrates below the trendline support, it may retreat and test the 9,600.0 psychological level. However, any sustained weakness below the 9,600.0 level may lead to selling pressure toward the 9,550.0 level. Meanwhile, the RSI is moving strongly in the overbought territory, while the MACD is widening away from the signal line in a bullish manner with no immediate trend reversal signs, suggesting a higher move. Thus, traders may adopt a bullish approach, but keep a close watch near the ascending trendline support for any reversal.
Definitions of key terms used in technical analysis
RSI (Relative Strength Index) indicator – RSI is a momentum oscillator that measures the speed and change of price movements. The RSI oscillates between 0 to 100. The index is deemed to be overbought once the RSI approaches the 70 level, indicating that a correction is likely. On the other hand, if the RSI approaches 30, it is an indication that the index may be getting oversold and therefore likely to bounce back.
MACD (Moving Average Convergence Divergence) indicator – The indicator consists of the MACD line and a signal line. The divergence or the convergence of the MACD line with the signal line indicates the strength in the momentum during the uptrend or downtrend, as the case may be. When the MACD crosses the signal line from below and trades above it, it gives a positive indication. The reverse is the situation for a bearish trend.
Candlestick chart – A candlestick chart is a price chart that displays the high, low, open, and close for a security. The ‘body’ of the chart is portion between the open and close price, while the high and low intraday movements form the ‘shadow’. The candlestick may represent any time frame. We use a one-day candlestick chart (every candlestick represents one trading day) in our analysis.
Doji candlestick pattern – A Doji candlestick is formed when a security’s open and close are practically equal. The pattern indicates indecisiveness, and based on preceding price actions and future confirmation, may indicate a bullish or bearish trend reversal.