


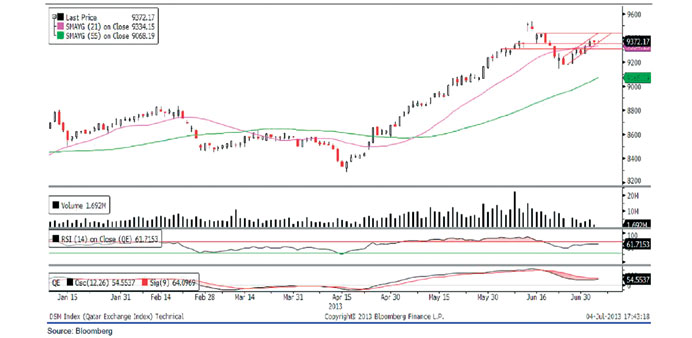
Technical analysis of the QE index
The QE Index continued its upward move last week, breaching its two resistances of 9,310.0 and 9,354.0. This is seen as a major development for the index. Moreover, the index closed above the 9,354.0 level – a positive sign for the buyers, which indicates that the uptrend is still intact. Going forward, the 9,400.0 level remains to be the next immediate target for the index, which if breached, may spark additional buying interest and lead to a test of the 9,500.0 level. The only sign of concern remains the relatively low volumes as compared to last week .We believe the index may continue to trade higher till the time it holds and closes above the 9,300.0 psychological level. However, traders are advised to keep a close watch on both the levels at 9,400.0 on the upside and 9,300.0 on the downside for any trend reversal or breakout signals. Any sustained weakness below the 9,300.0 level may pull the index to test the 9,200.0 level, followed by support at 9,100.0. Meanwhile, both momentum indicators are mixed with the RSI stalling, while the MACD is moving along the signal line.
Definitions of key terms used in technical analysis
|
|
RSI (Relative Strength Index) indicator – RSI is a momentum oscillator that measures the speed and change of price movements. The RSI oscillates between 0 to 100. The index is deemed to be overbought once the RSI approaches the 70 level, indicating that a correction is likely. On the other hand, if the RSI approaches 30, it is an indication that the index may be getting oversold and therefore likely to bounce back.
MACD (Moving Average Convergence Divergence) indicator – The indicator consists of the MACD line and a signal line. The divergence or the convergence of the MACD line with the signal line indicates the strength in the momentum during the uptrend or downtrend, as the case may be. When the MACD crosses the signal line from below and trades above it, it gives a positive indication. The reverse is the situation for a bearish trend.
Candlestick chart – A candlestick chart is a price chart that displays the high, low, open, and close for a security. The ‘body’ of the chart is portion between the open and close price, while the high and low intraday movements form the ‘shadow’. The candlestick may represent any time frame. We use a one-day candlestick chart (every candlestick represents one trading day) in our analysis.
Doji candlestick pattern – A Doji candlestick is formed when a security’s open and close are practically equal. The pattern indicates indecisiveness, and based on preceding price actions and future confirmation, may indicate a bullish or bearish trend reversal.