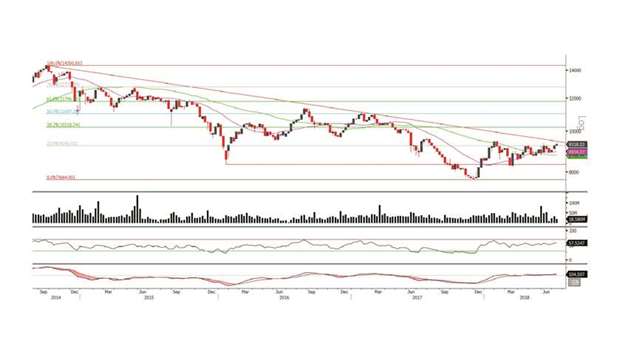
The General Index managed to close slightly up for the week by 0.63% from the week before. In addition, the Index managed to approach the 9,370 level. As a result, we reiterate our last week’s statement that the Index is in a strong position to reach the 9,500 level, but we wait on how that challenge will unfold to determine the next direction for the Index. The major resistance levels are around the 9,500-9,600 points and the closest support is around the 8,600 level.
Definitions of key terms used in technical analysis
Candlestick chart – A candlestick chart is a price chart that displays the high, low, open, and close for a security. The ‘body’ of the chart is portion between the open and close price, while the high and low intraday movements form the ‘shadow’. The candlestick may represent any time frame. We use a one-day candlestick chart (every candlestick represents one trading day) in our analysis.
Doji candlestick pattern – A Doji candlestick is formed when a security’s open and close are practically equal. The pattern indicates indecisiveness, and based on preceding price actions and future confirmation, may indicate