By Clyde Russell /Launceston, Australia
While the price of gold has meandered in a narrow range this year, gold equities have improved somewhat and an analysis of relative performance suggests they may have further to rally.
Spot gold ended Thursday’s trade at $1,183.85 an ounce, largely unchanged from $1,183.55 at the end of 2014, as the precious metal battles the competing influences of a firmer dollar and concerns over a Greek exit from the eurozone.
However, major gold miners have shown some improvement, with the S&P TSX Global Gold Index gaining 14% so far this year.
The Toronto Stock Exchange-based index groups together the world’s top gold producers, including No 1 Barrick Gold Corp, which is up 20.5% this year in US dollar terms, and No.2 Newmont Mining Corp, which has gained 40%.
The No 3 producer, Johannesburg-listed AngloGold Ashanti , is up 32% since the start of the year in dollar terms. These are impressive gains for the top gold miners, especially given the steady price of the precious metal.
However, gold equities are still vastly undervalued relative to the spot price.
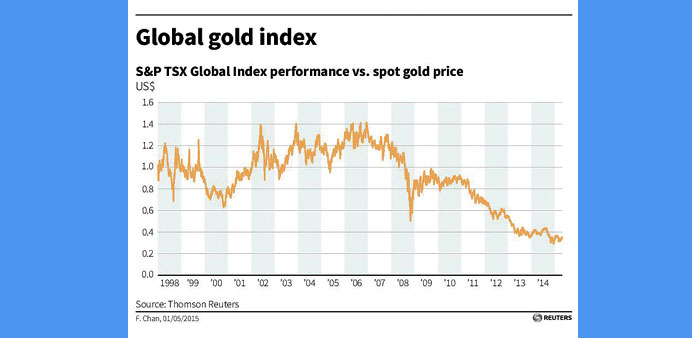
A relative performance chart using the S&P TSX Global Gold Index and the spot gold price shows a value of 0.351 as of April 30.
A reading of 1 means the neither instrument is out- or under-performing the other, while a reading of 0.5 means the first is under-performing the second by 50%.
At the current value, this means the gold equity index is underperforming the gold price by a margin of almost 65%.
This is slightly higher than the 0.291 recorded on December 16, 2014, which is the lowest value since Reuters data started in 1998.
What this means is that despite the recent rally in gold equities, they are still close to the lowest relative to spot gold in at least 17 years.
History shows that gold equities outperformed spot gold for most of the time between 2002 and the global financial crisis of 2008, a time when both shares and commodities such as gold were rallying.
However, after the 2008 global recession, gold equities resumed their underperformance, and this accelerated as the spot gold price collapsed from its record high of $1,920.30 an ounce in September 2011.
So what will it take for gold equities to reverse their underperformance of the gold price?
The most obvious answer is that the equities tend to outperform on a sustained basis when gold prices are rallying, but it may be possible for the shares to make gains even if the gold price remains largely steady.
Part of the reason for the decline in gold has been the increase in physical supply, with mine supply rising steadily in response to a decade-long price rally between 2001 and 2011.
Data from metals consultant Thomson Reuters GFMS shows mine supply has risen from 2,742.4 tonnes in 2010 to 3,129.4 in 2014, which helped drive the market into oversupply to the tune of 358.7 tonnes last year.
However, GFMS expects mine supply to decline slightly this year, and then again in 2016 and 2017, with the overall gold market expected to return to deficit by 2017.
In this scenario, which is GFMS’ base case, the gold price will recover “slowly” in 2016 and 2017, the research team said in an April 28 update.
However, gold equities may recover faster than the gold price, especially if there is a decline in mine supply, which would leave remaining companies better placed to take advantage of a tightening physical market.
*Clyde Russell is a Reuters columnist. The views expressed are his own.