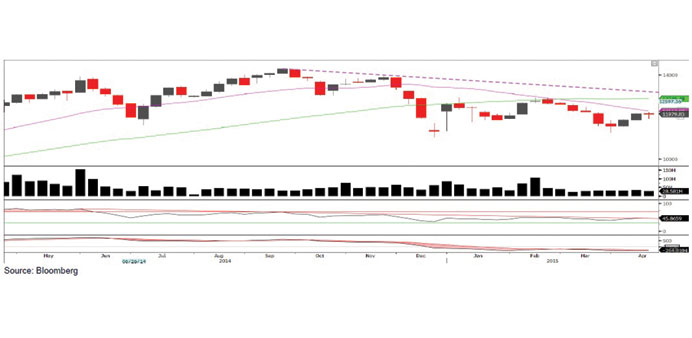
The Index created a long-legged Doji candlestick on the weekly frame which shows that traders reached an equilibrium level among buyers and sellers. The RSI is close to the 50 area which is neutral, and the MACD’s histogram is also near the zero.
This confirms that the Index is trading in a range on the weekly time frame and thus traders are still looking for a general direction to the market before making serious commitments to buy or to sell the general market. The base and the strongest support is seen around 11,200 and the resistance around 12,100 points.
Definitions of key terms used in
technical analysis
Candlestick chart – A candlestick chart is a price chart that displays the high, low, open, and close for a security. The ‘body’ of the chart is portion between the open and close price, while the high and low intraday movements form the ‘shadow’. The candlestick may represent any time frame. We use a one-day candlestick chart (every candlestick represents one trading day) in our analysis.
Doji candlestick pattern – A Doji candlestick is formed when a security’s open and close are practically equal.
The pattern indicates indecisiveness, and based on preceding price actions and future confirmation, may indicate a bullish or bearish trend reversal.