Technical analysis of the QE index
|
|
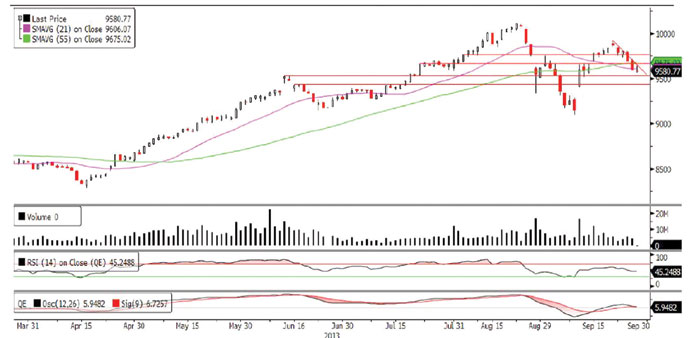
The QE Index failed to make any further headway above the 9,900.0 mark last week and retreated by around 291 points erasing the consecutive gains witnessed in the past two weeks, thus dashing the hopes of reaching the psychological 10,000.0 level. The bears proved to be too strong for the bulls as the index witnessed sustained selling pressure throughout the week except on Monday. The index penetrated below few important psychological levels (9,800.0, 9,700.0 and 9,600.0) and both the 21-day and 55-day moving averages last week and showed no reversal signs. On the downside, the important level now for the traders to watch out is the band near 9532.0-9500.0, which is a psychological as well as a technical support area. A breakdown below this level may have bearish implications, which may result in bears taking full command over the bulls and pull the index to test 9,400.0. Any sustained weakness below this level may prompt the index to test 9,300.0. On the flip side, the index needs to move upward and reclaim the 9,600.0 psychological level and both the moving averages in the coming week, in order to keep its upward hopes alive. Meanwhile, both momentum indicators are giving bearish signals, thus suggesting a further downside. Thus, traders may keep a low profile but must also keep a close watch on the 9,600.0 level and the moving averages for any reversal signs.
Definitions of key terms used in technical analysis
RSI (Relative Strength Index) indicator – RSI is a momentum oscillator that measures the speed and change of price movements. The RSI oscillates between 0 to 100. The index is deemed to be overbought once the RSI approaches the 70 level, indicating that a correction is likely. On the other hand, if the RSI approaches 30, it is an indication that the index may be getting oversold and therefore likely to bounce back.
MACD (Moving Average Convergence Divergence) indicator – The indicator consists of the MACD line and a signal line. The divergence or the convergence of the MACD line with the signal line indicates the strength in the momentum during the uptrend or downtrend, as the case may be. When the MACD crosses the signal line from below and trades above it, it gives a positive indication. The reverse is the situation for a bearish trend.
Candlestick chart – A candlestick chart is a price chart that displays the high, low, open, and close for a security. The ‘body’ of the chart is portion between the open and close price, while the high and low intraday movements form the ‘shadow’. The candlestick may represent any time frame. We use a one-day candlestick chart (every candlestick represents one trading day) in our analysis.
Doji candlestick pattern – A Doji candlestick is formed when a security’s open and close are practically equal. The pattern indicates indecisiveness, and based on preceding price actions and future confirmation, may indicate a bullish or bearish trend reversal.