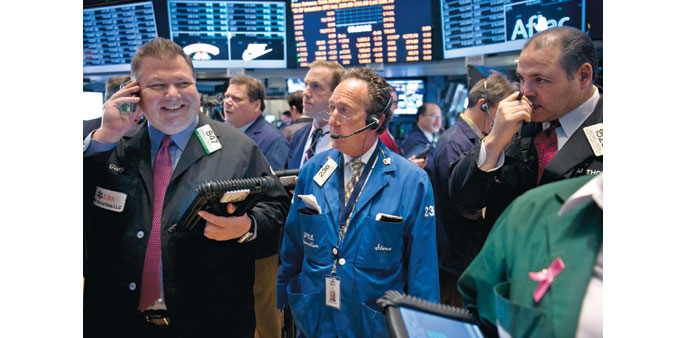
Traders work on the floor of the New York Stock Exchange. While markets have held near record levels, there are signs equities have gotten stretched and could be vulnerable this week, when a number of key economic indicators come out.
Reuters
New York
The US stock market has been quiet last week – too quiet.
Wall Street has traded in a tight range of late, with both volatility and trading volumes drying up as the earnings season winds down and Federal Reserve Chair Janet Yellen’s recent Congressional testimony delivered no surprises.
While markets have held near record levels, there are signs equities have gotten stretched and could be vulnerable this week, when a number of key economic indicators come out.
If any of those, including the February payroll report, extends a recent trend of disappointing data, that could shock indexes out of their ranges and send them lower.
About 238,000 jobs are expected to have been added in February, according to the non-farm payroll report that will be released on Friday, down from the 257,000 added in January. Separately, readings on both the manufacturing and services sectors are on tap, as is a report on factory orders.
“Economic data will be the biggest driver of market moves over the next month, and the key one is the jobs report,” said Jim McDonald, chief investment strategist at Chicago-based Northern Trust Asset Management. “Right now, there continues to be a reasonable amount of skepticism regarding the market outlook.”
Recent data has pointed to weakening conditions. Growth slowed more sharply than initially thought in the fourth quarter, while the Institute for Supply Management-Chicago Business Barometer’s fell to its lowest since July 2009.
The S&P 500 has not seen a 10% correction since mid-2012. Valuation remains a concern.
The S&P 500 has a price-to-earnings of 17.4, above its historical average of 14.8. On a forward P/E basis, most of the S&P’s sectors also look expensive, with financials the only sector with a P/E below the benchmark’s historical average.
“I’d have to go outside the stock market to find areas of value,” said McDonald, who oversees $932bn. “There just aren’t individual pockets of the market that you would describe as cheap.”
Over the past five sessions, an average of about 6.26bn shares traded on all US platforms, according to BATS exchange data, nearly 8% below the month-to-date average of 6.8bn. The S&P moved in its narrowest range since Christmas Eve on Friday; it is also closing out its narrowest weekly range since Thanksgiving this week.
Despite the thin trading, the Dow, S&P and Russell 2000 all hit record levels this week. The CBOE Volatility index, a measure of investor anxiety, on Friday fell 2% to 13.61, well under its historical average of 20.
The volatility index for the Russell is also well below its historical average, falling 1.2% to 16.06 on Friday.
“The billion-dollar question is, has everyone gotten so complacent that we could see things roll over?” said Michael Matousek, head trader at US Global Investors in San Antonio. “If nothing changes, investors may just keep following things higher, but the high in the Russell and the low in Russell volatility suggest things could really take a hit if anything bad happens.”
Some of the market’s biggest recent gainers could be the most vulnerable to a pullback. The Nasdaq biotech index has rallied for three straight weeks, up nearly 7% over that period. Small-caps could also be ripe for profit-taking, with the S&P 600 small-cap index up for four straight weeks, gaining 6.4% over that period.