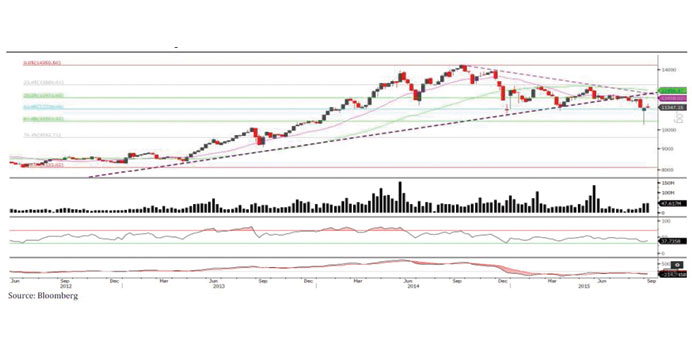
The QSE index could be in the process of recovery after the harsh correction it experienced thus far. It closed marginally up by 0.46% from the week before. To better confirm this recovery, the index needs to trade on higher volumes above the 11,560 level. It should be noted that, from a technical standpoint, the index is still in a downtrend and selling pressure may persist over the longer term.
Candlestick chart – A candlestick chart is a price chart that displays the high, low, open, and close for a security. The ‘body’ of the chart is portion between the open and close price, while the high and low intraday movements form the ‘shadow’. The candlestick may represent any time frame. We use a one-day candlestick chart (every candlestick represents one trading day) in our analysis.
Doji candlestick pattern – A Doji candlestick is formed when a security’s open and close are practically equal. The pattern indicates indecisiveness, and based on preceding price actions and future confirmation, may indicate a bullish or bearish trend reversal.